Continuous Profiling dashboard
Back to home
On this page
Continuous profiling is a multi-dimensional performance optimization technique where web applications are monitored and profiled in real-time. Lightweight and scalable, it’s tailored for holistic application oversight.
Continuous profiling collects performance data continuously, enabling developers to gain deep insights into their application’s behavior, identify bottlenecks, and optimize code for better performance and resource utilization. This proactive approach allows for quicker identification and resolution of performance issues, ensuring the smooth running of software in live environments.
Continuous profiling on Upsun 
Upsun Continuous Profiling is powered by Blackfire.
It is available directly from the Console under the Profiling tab of your environments.
The Continuous Profiling dashboard lets you visualize the profiling data of a specific application. It is composed of several views: flame graph, table view, sandwich view and a split view combining the flame graph and table views.
Each view helps make sense of the profiling data for the selected dimension and time frame. The available dimensions vary with the runtime profiled.
Flame graph
The flame graph is a hierarchical visualization of the contribution of the different function calls to the selected dimensions.
Flame graphs are effective in identifying performance issues and understanding the behavior of software during execution.
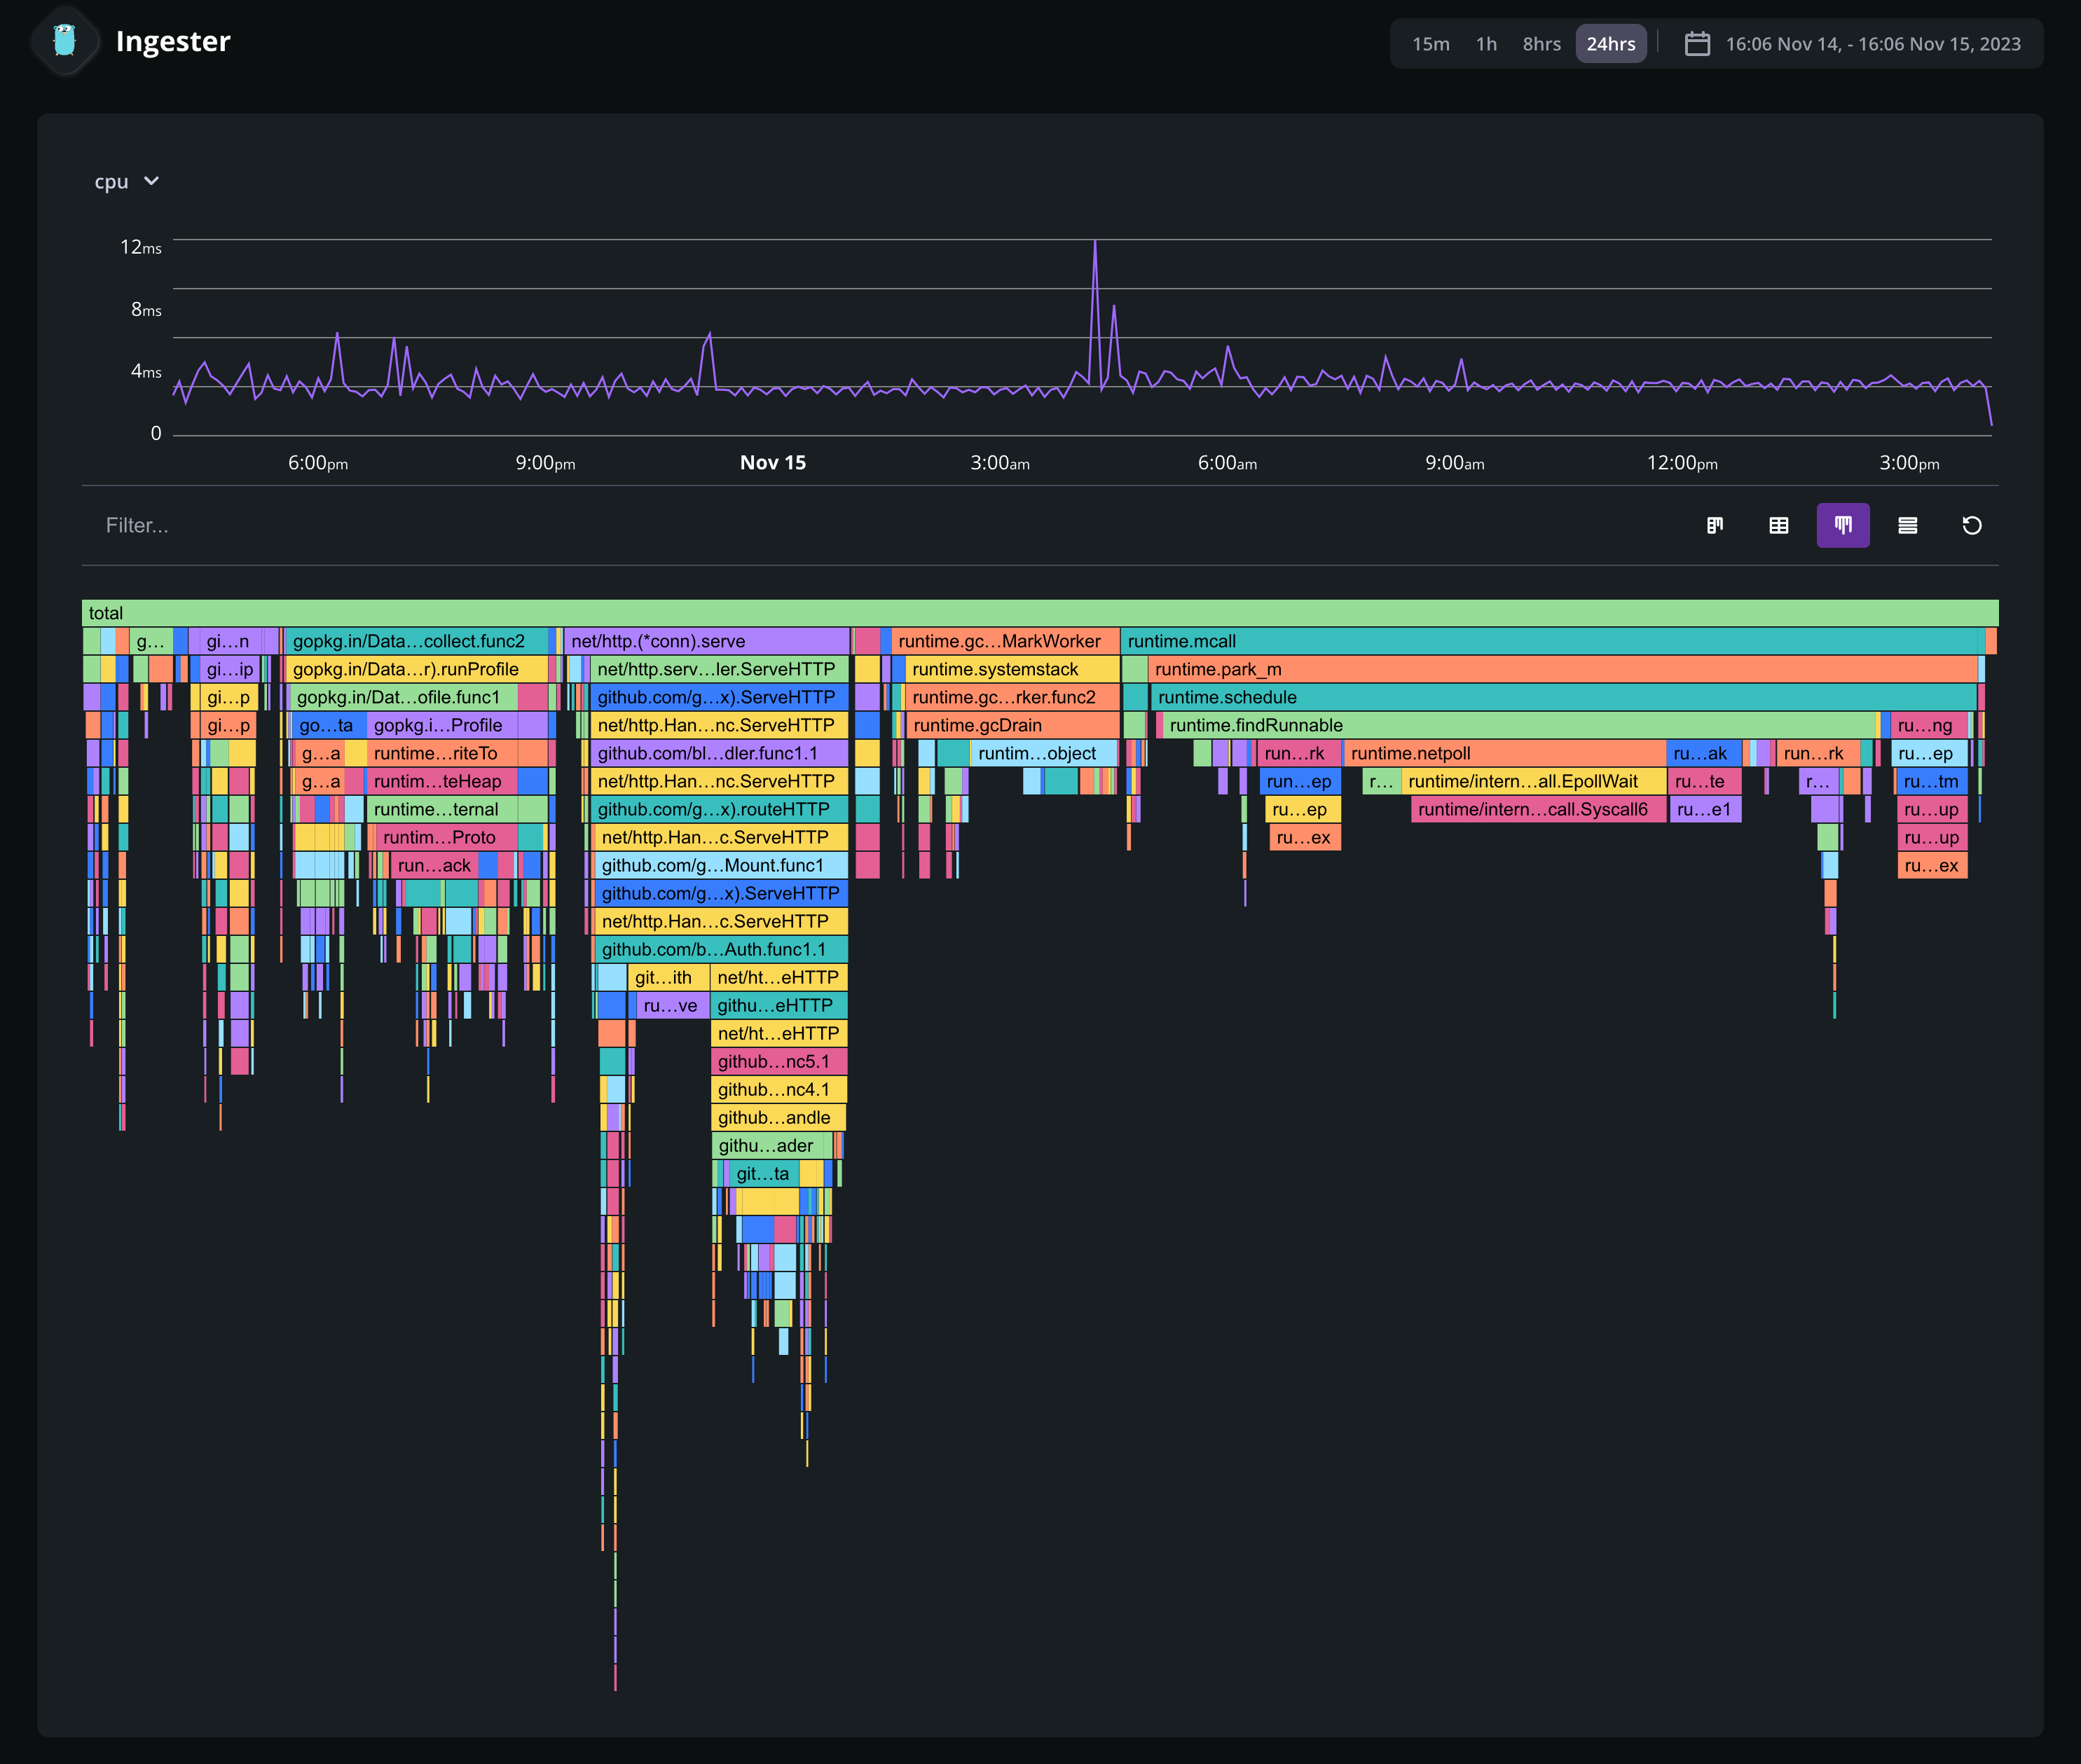
Rectangles in a flame graph are called frames. Each frame represents a function, arranged vertically (y-axis) to show the sequence of method calls.
The width of a frame relates to its resource usage. It helps pinpoint the most resource-intensive function calls. Their colors are not performance-related. They are meant to differentiate between functions.
Horizontally (x-axis), methods are sorted by name, not the order in which they run.
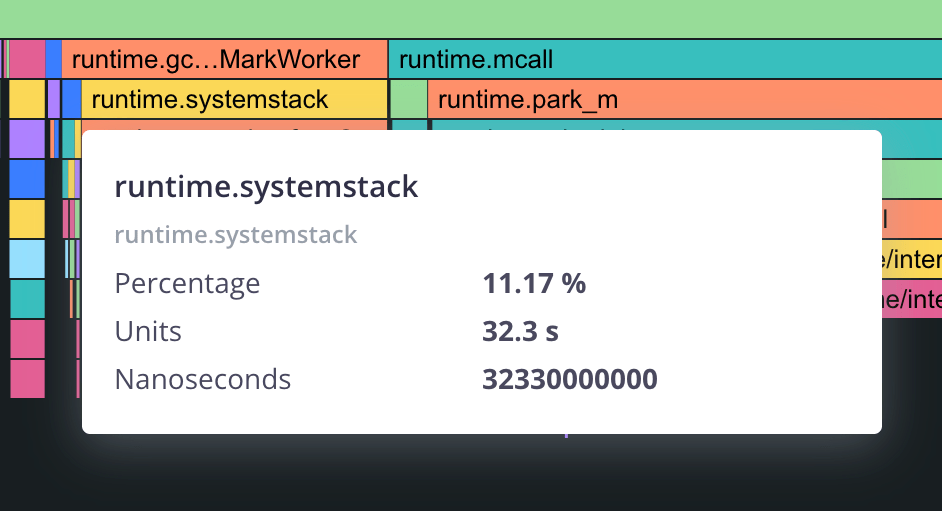
Hovering a frame displays in-depth information on it.
Clicking on a frame narrows down the flame graph to the callers and callee nodes of that frame.
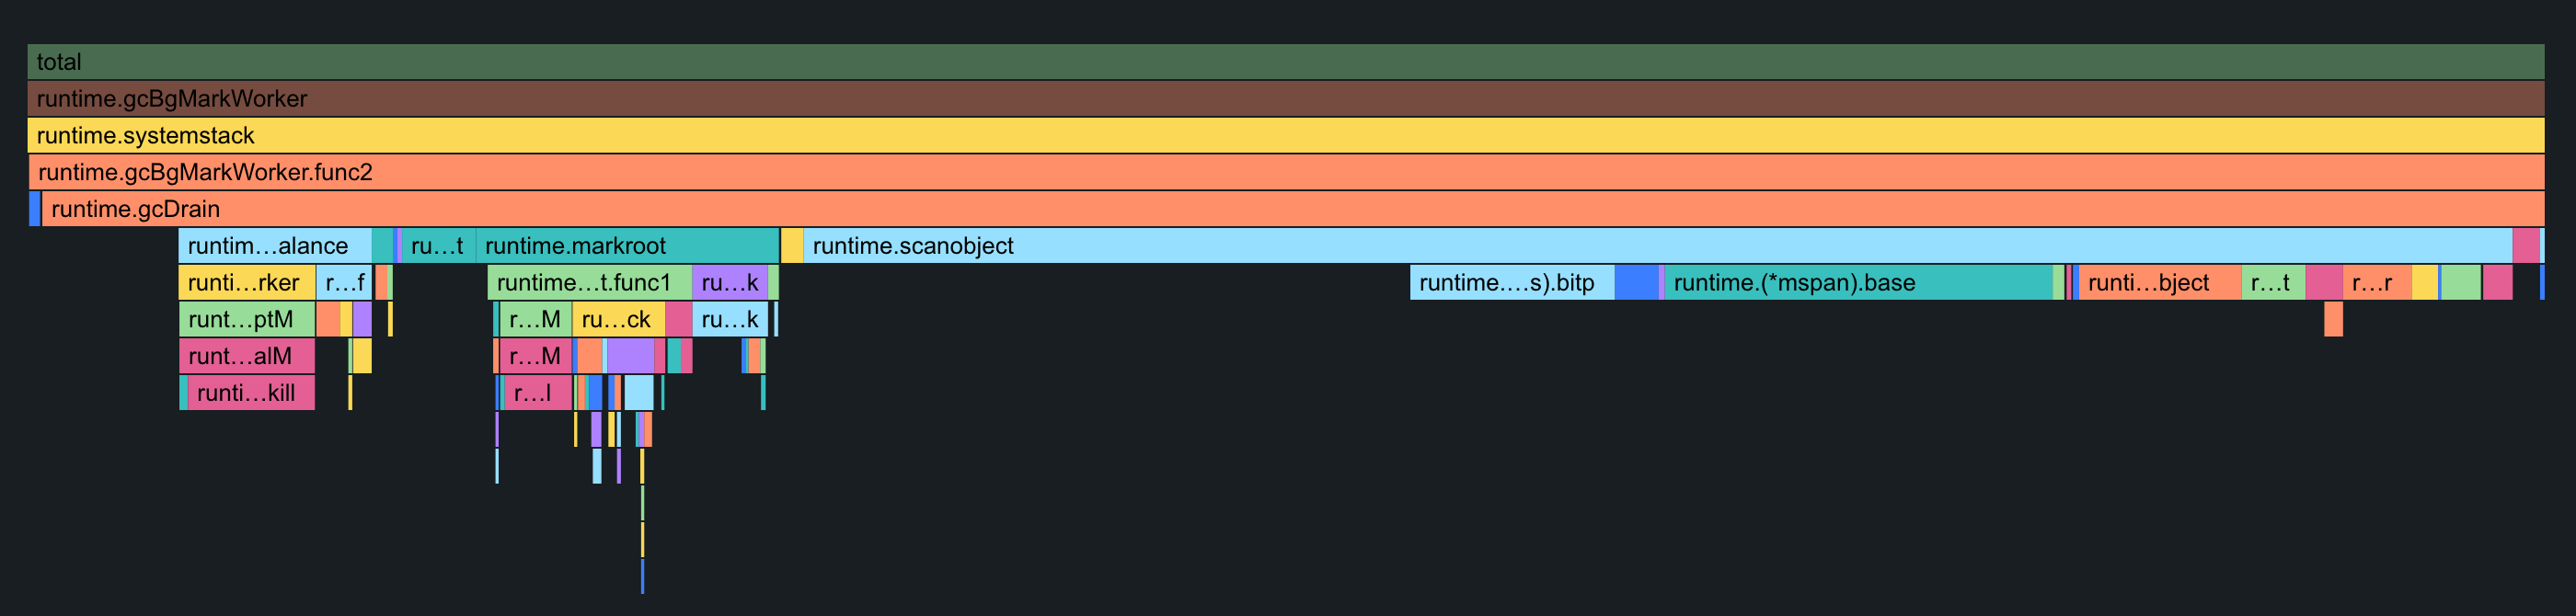
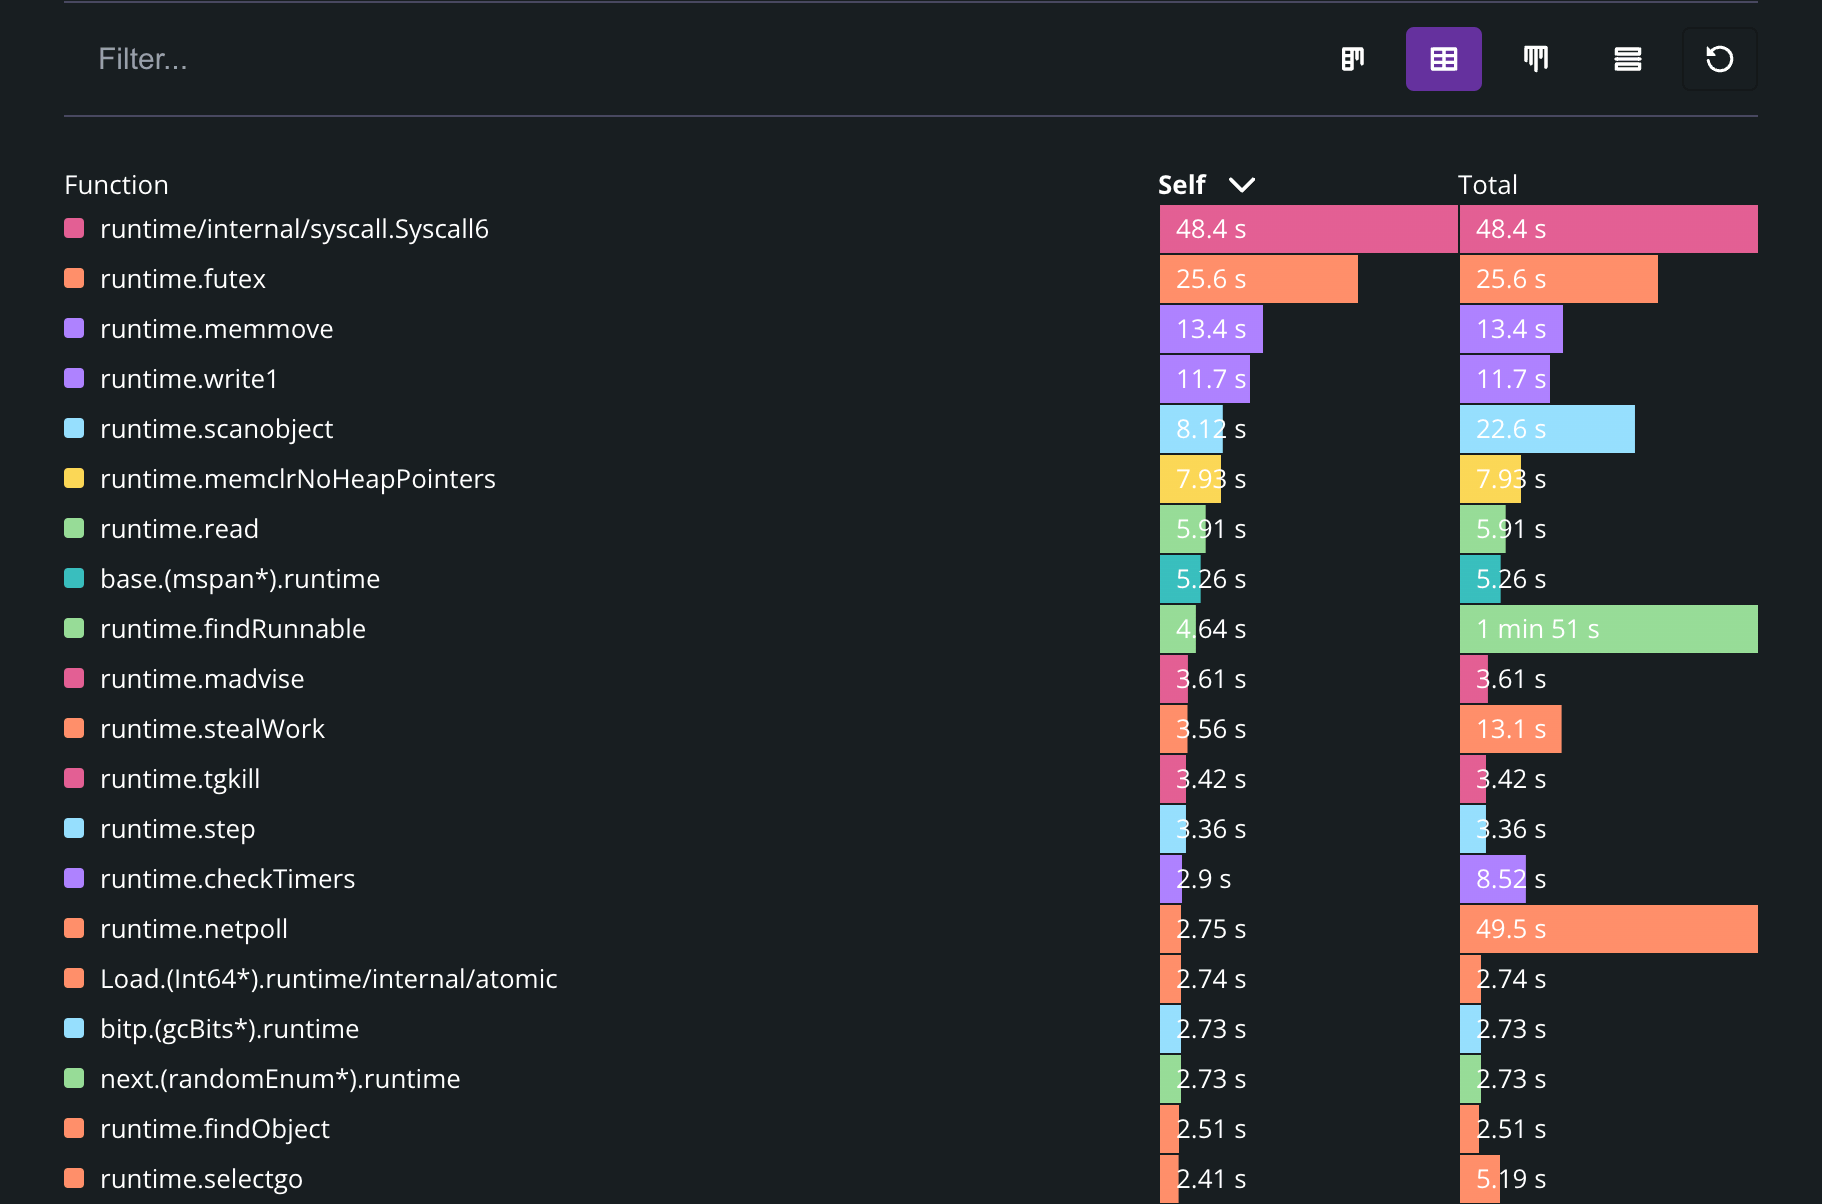
Table view
The table view displays a list of all the frames sorted by their resource consumption, for the selected dimension and timeframe. By default, the table is sorted by self resource consumption, which is the total value of the frame, minus the combined total values of its direct children.
Sandwich view
The sandwich view displays the context of the selected frame with the function’s callers on top and callees at the bottom.
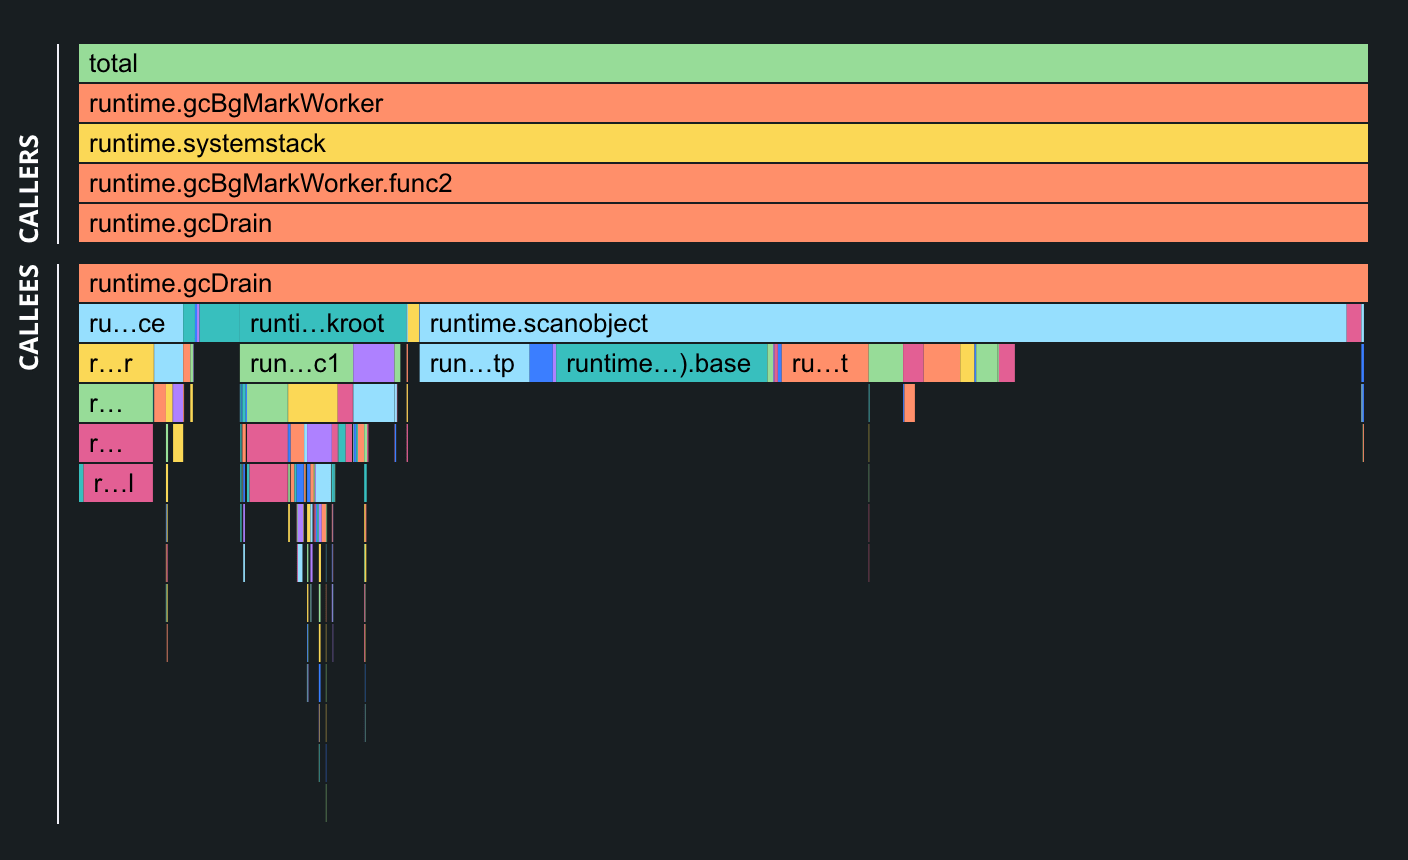
This view provides a combined overview of the function’s context. If the function appears in several spots in the flame graph, all these contexts are aggregated and displayed in the sandwich view.